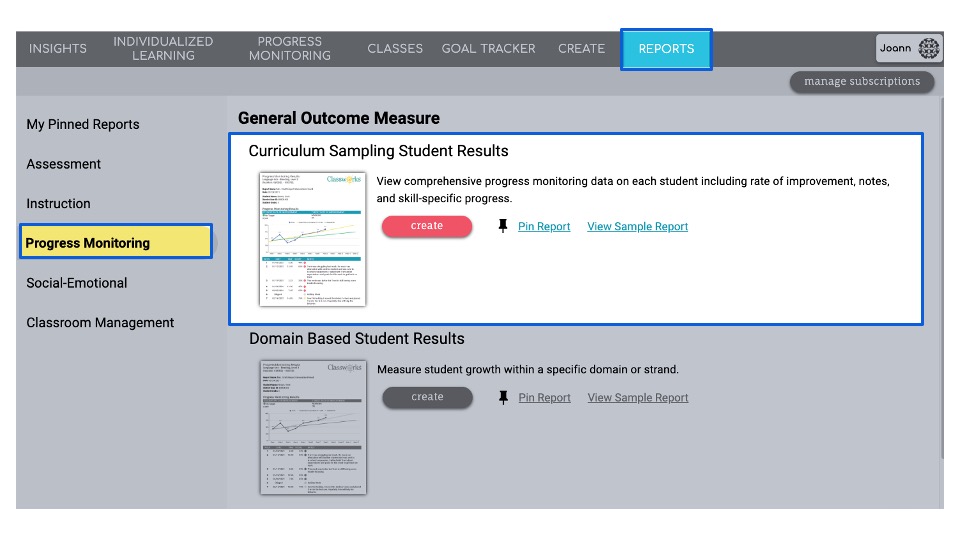
Curriculum Sampling Progress Monitoring Student Results
This is the report that educators use to maintain communication with caregivers about the progress their child is making. Student Support Teams (SST), MTSS teams, and Child Find teams also refer to the information in this report to guide adjustments to the student's intervention plan.
Step-by-Step Guidance
Navigate to the Reports screen
Select Progress Monitoring
Scroll to Curriculum Sampling Student Results and click Create
Select which students you would like to generate this report for using these steps here.
Choose the Report Options
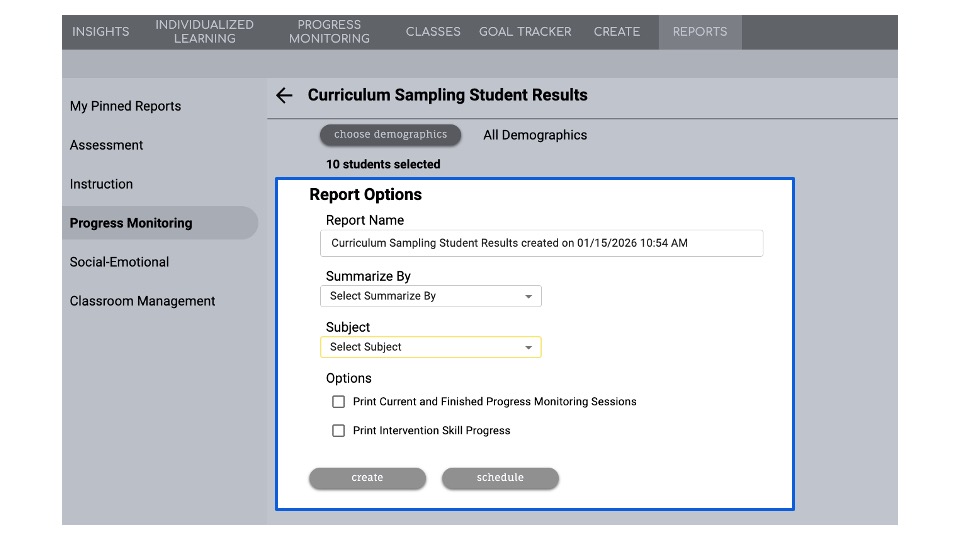
- Edit the Report's Name
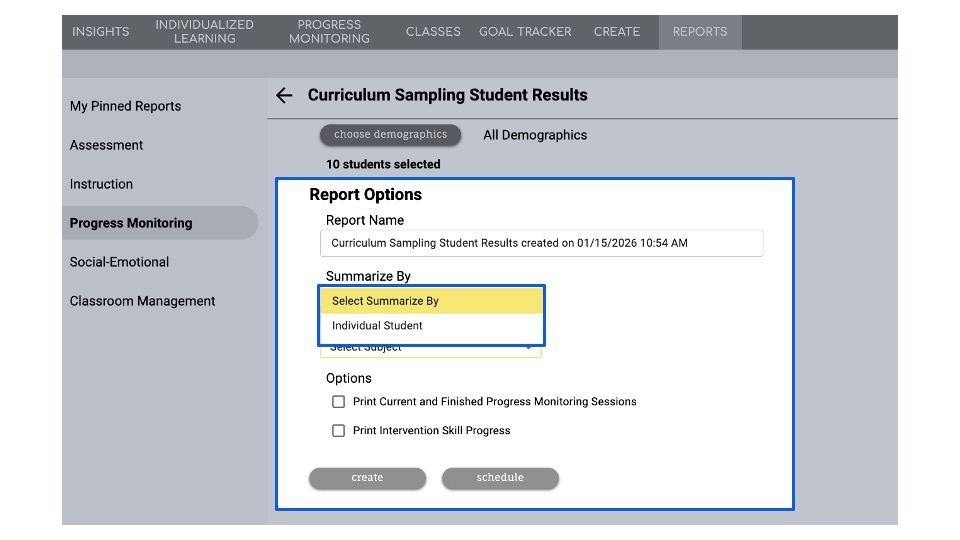
- Use the dropdown menu in Summarize by to select Individual Student
- Select the content area
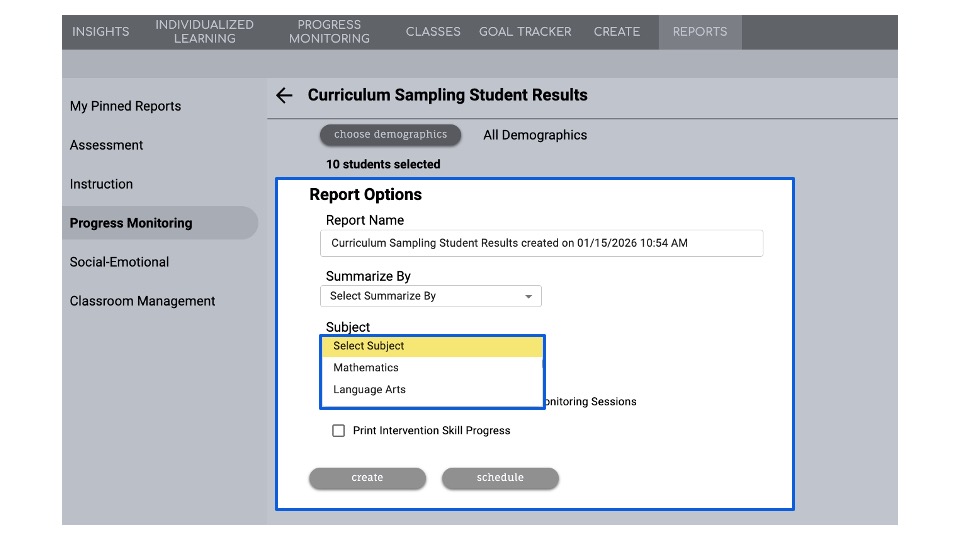
This report is designed to be run for each content area separately.
Choose additional options (if desired)
- Print Current and Finished Progress Monitoring Sessions: Will include all sessions the student has completed during the academic year. This option is frequently used when running this report at the end of the school year to capture all the gains made by each student during the year.
- Print Intervention Skill Progress: Will include a list of the ILP units and unit averages completed by the student. This is frequently used when teachers want to compare Progress Monitoring performance with correlated instructional performance.
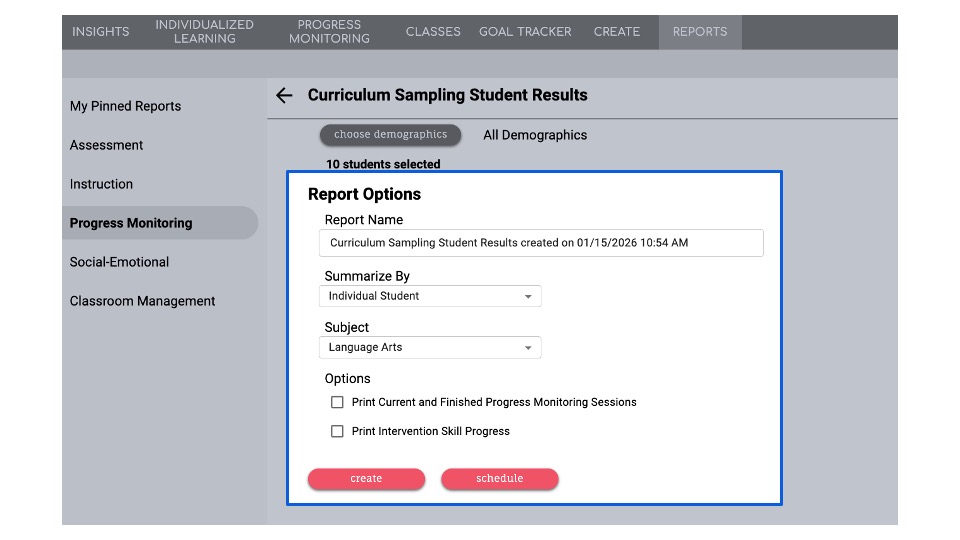
Click Create
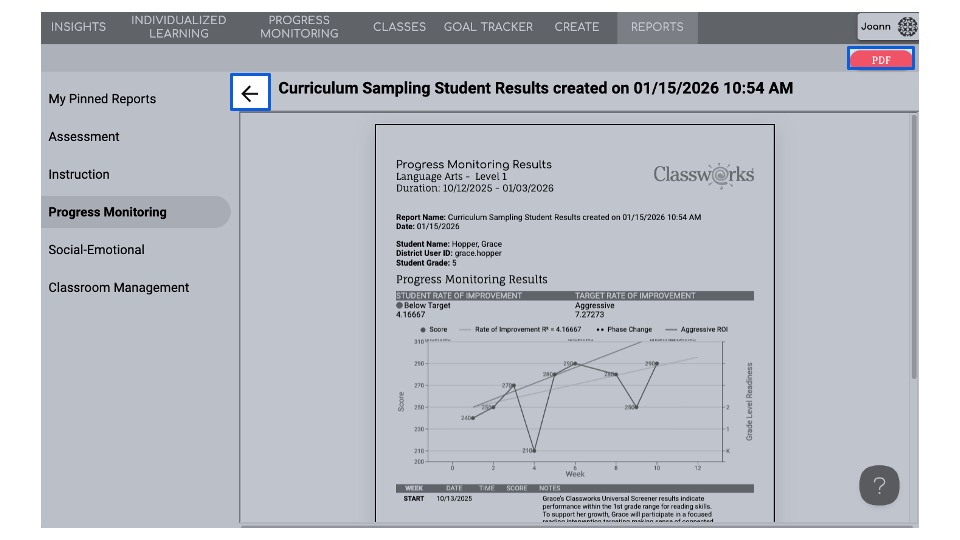
A new window will open with a preview of your report
- Review the report
- Click the back arrow in the top left corner to go back to the settings screen and make changes
- Click the PDF in the top right corner to view this report in full screen and save or print it.
What To Look For
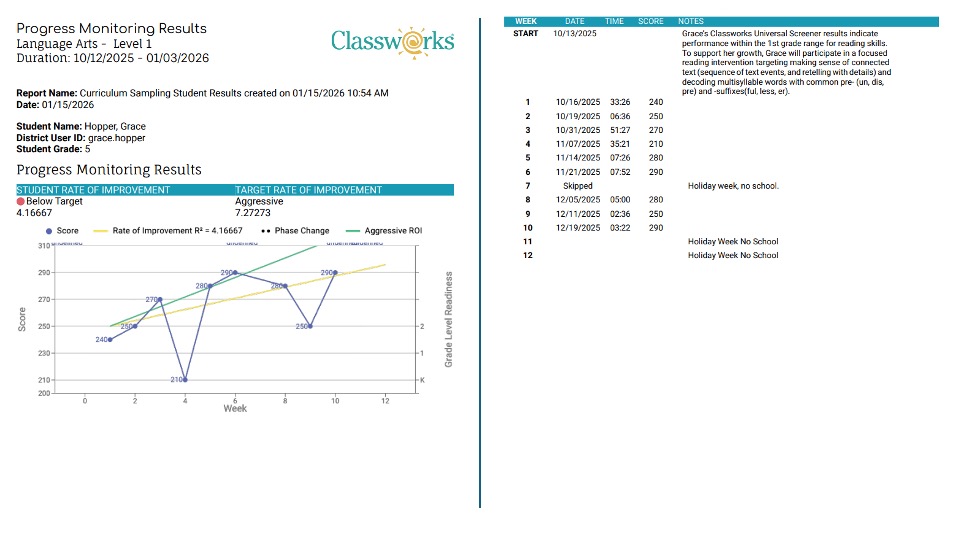
Graph
A line graph displaying the student's actual weekly performance, target rate of improvement trend line, and actual performance trend line
Students see a simplified version of this graph in their My Progress Check section on their landing page.
Narrative
A table displays each probe administration, including the date the probe was completed and the student’s overall score for that session.
When setting up progress monitoring, teachers are prompted to enter a brief description of the intervention the student is receiving.
This description is included at the top of the table and documents the instructional support in place and clarifies what the progress monitoring session is measuring, helping ensure data is interpreted accurately over time.
The Notes column includes teacher-authored comments to provide additional narrative. In the sample report below, the teacher used this comment feature to provide an explanation for the weeks where the probes were not completed.
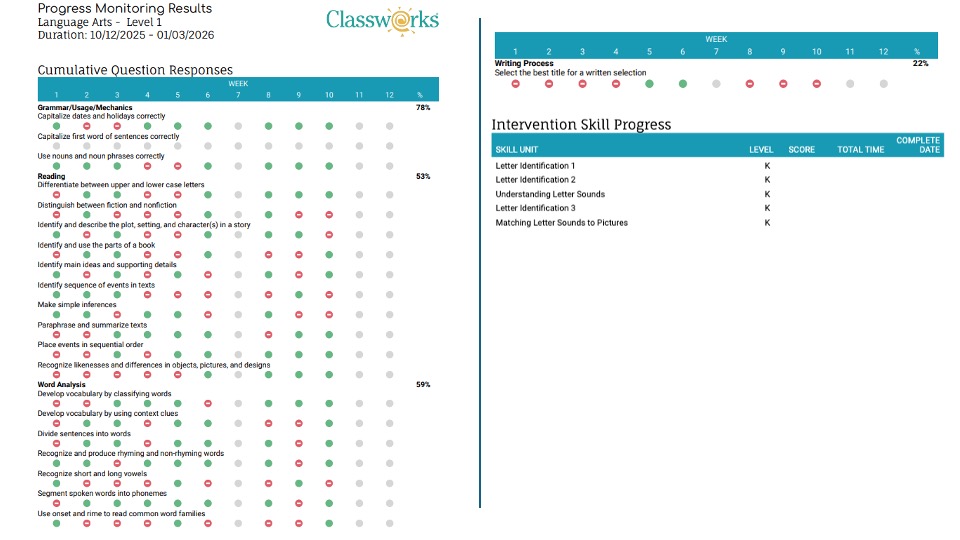
Cumulative Question Responses
A grid table that states the domains and specific objectives measured through the progress monitoring probes.
The color of the dot indicates how the student performed with these questions on each probe
- Red dots: The student answered 39% or fewer questions correctly
- Yellow dots: The student answered between 40% - 59% of the questions correctly
- Green dots: The student answered more than 60% of the questions correctly
- Grey dots indicate the question was not answered
The running average for each domain is shown along the right side of the table
In the sample report below, the student did not complete their probe during weeks 7, 11, and 12
The student has a running average of 53% in the Reading domain
Optional Settings
Previous Progress Monitoring Sessions
Intervention Skill Progress
When selected, a list of ILP units will appear below the Cumulative Question Responses section of the report.