How do I interpret students' curriculum sampling progress monitoring results?
Introduction
- Students' Progress Monitoring results are automatically graphed
- A trend line is added to the graph after the student has completed at least 3 CBMs
- Curriculum Sampling performance is scored using the same Scale Score used on the Universal Screeners; this makes it easier to track growth in between the screener windows.

Classworks measures the effectiveness of the intervention by taking into account the students:
- chronological grade level of the grade level of the CBM
- trend line compared to the target rate of improvement
View each student's results by navigating to the Progress Monitoring page, selecting the subject, and clicking 'View Details.'

A printed report, "Progress Monitoring Results," can also be generated to share progress with parents and guardians.
Reading the Graph
- Compare the student’s trend line to the target line
- Over time, the student’s trend line should be sloping very closely to the target rate of improvement (ROI) line
The trend line is automatically updated to provide an estimated amount of growth throughout the CBM session.
Focusing on the yellow trend line provides more insight than the individual scores (they are used to calculate the trend).
- If it is sloping steeply above or below the target line, the student’s intervention might need an adaptation

- Look at the graph above. In this example, the student is responding well to the interventions currently in place.
- The graph verifies this statement because the student's trend line (yellow) is closely aligned to the target rate of improvement (green line).
Let's look at two examples!
There are three lines on each graph to notice.
- The yellow line is the student's trend line.
- The green line is the student's Target Rate of Improvement. It shows the expected achievement trend.
- The blue line with the dots shows the student's actual weekly CBM scores.
Student 1: Trending below target - Adaptation Needed
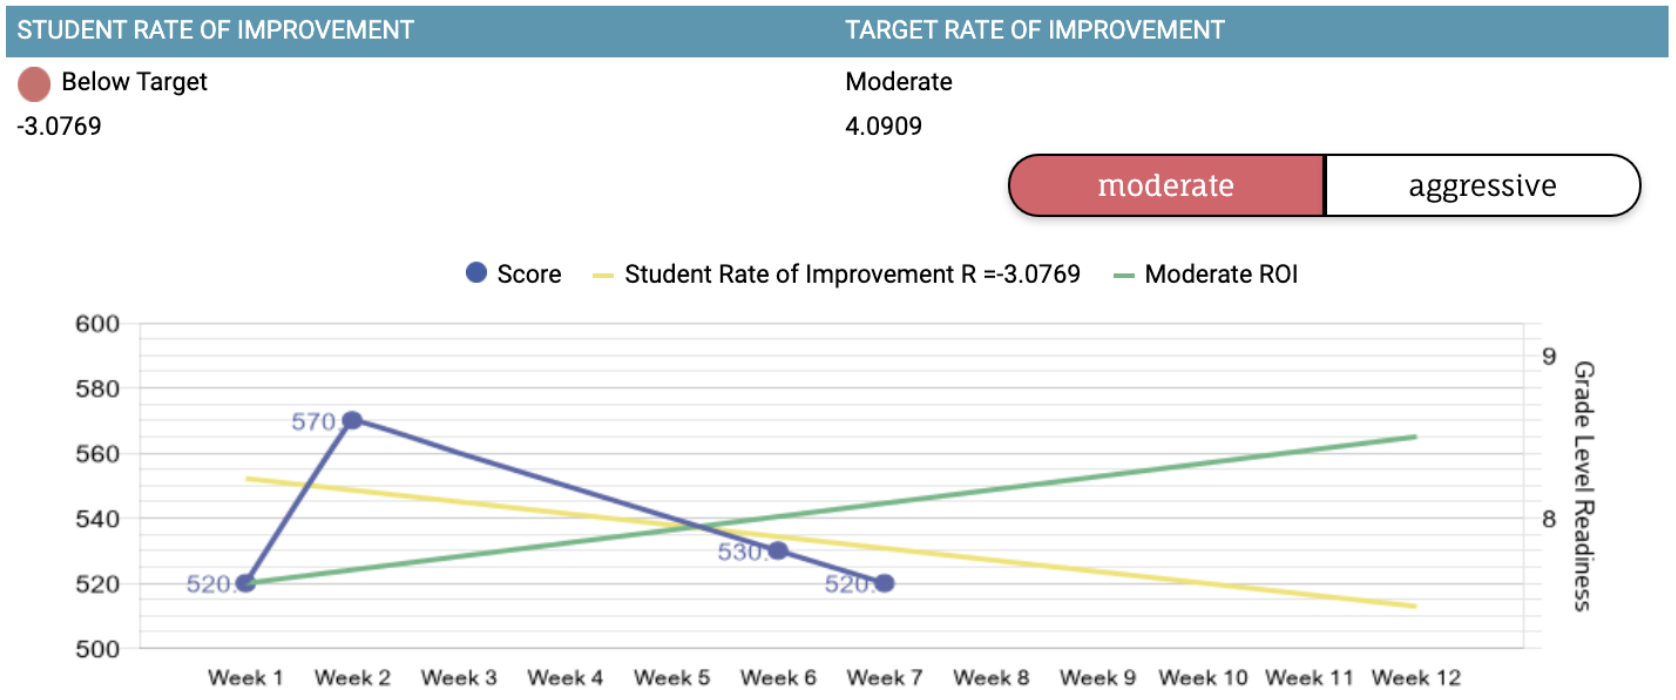
- Student 1’s Rate of Improvement (yellow line) is trending below the Target Rate of Improvement (green line).
- It may be best to reevaluate the student’s intervention since the student's trend line is declining.
- Adding a "Phase Change" makes it easy to document when you adjusted the intervention and how the intervention was adjusted.
Student 2: Trending above target

- Student 2’s Rate of Improvement (yellow line) is trending well above the Target Rate of Improvement (green line).
- The student could be responding well to the current interventions since the student’s performance is trending at a pace well above the Target Rate of Improvement
- This student may be a candidate for re-evaluation of their tier of support.
Graph Details
When viewing the graph, there are several things you should notice:
- Above the graph, the content area and grade level of the CBMs are displayed
- Notice the start and end dates for this progress monitoring session
- At the right side of the graph, 'Grade Level Readiness' illustrates how the scores earned correlate with different grade levels

- At the top of the graph, the student's rate of improvement and the target (expected) rate of improvement are displayed

There are three lines shown on this sample graph:
- The connected blue dots show how the student scored on each week's probe.
- The solid green line is the Target Rate of improvement for the 12-week duration. This is how much the student is expected to improve based on the current intervention. The target rate of improvement is determined by the goal that was selected: Moderate or Aggressive. This includes a number that shows the expected growth points each week (in this case, it is 3.3631 points per week for 12 weeks).
- The yellow line is the Current Rate of Improvement and is calculated based on the student's weekly results and estimates which way the student is heading based on their current trend. This line is calculated using a "least-squares" regression equation and requires at least 3 results. This also includes a number to show you the student's actual growth (in this case, it is +0.9091).
Assessment Details
The details of the Active progress monitoring session are the default view. Read more about viewing previously completed sessions.
When viewing the active session, you will notice the following:
- Week column indicates each week of the 12-week session included with the CBM session.
- Date column indicates the CBM completion date. It says Skipped if the student skipped (missed a week) or is blank if it is an upcoming week.

- Time column indicates the number of hours, minutes and seconds the student spent completing each CBM.

- Score column indicates the scale score earned by the student on each CBM.

- Notes column displays anecdotal notes that the teacher entered to provide a narrative of the student's performance on each CBM.

Cumulative Item Responses
- Below the graph and weekly details, you will find the Cumulative Item Response table.
- This table breaks down which domains and assessment objectives the student was tested on and how well they did.

- The table is organized by curriculum strand, with each skill or objective shown in its own row.
- The color dot shown represents a percent correct on the total items for that assessment objective.
- Red = 0% - 39%
- Yellow = 40% - 59%
- Green = 60% - 100%

- Look at this example. Rachel's performance with the 'Ask and answer questions while reading' skill varied each week.
- Weeks 1 and 4, she answered 60% or more of the questions correctly
- Weeks 2, 3, 5, 6, and 8 - 12 she answered less than 40% of the questions correctly
- Week 7 is grayed out because Rachel didn't complete the CBM that week
Item-Level Analysis
The actual question, correct and incorrect responses are accessible by clicking on each score dot.
