Universal Screener Results: Rtl Recommendations
The RtI (Response to Intervention) Recommendations report displays student results from a specific Universal Screener administration. This report helps educators identify students who may need additional evaluation or targeted intervention as part of the RtI process.
All results are presented using a common vertical scaled score, allowing for consistent comparison of student performance across grade levels and administrations. This supports data-informed decision-making when planning next steps for instruction and intervention.
The Universal Screener assessment is designed to identify a student’s readiness for on-grade level instruction. It is typically administered three times per year, though many districts also use it on an ongoing basis as part of an MTSS framework. Universal Screeners are available in Math and Reading/Language Arts and are developed for each grade level, kindergarten through high school.
Assessment Structure and Grade-Level Reach
To accurately identify readiness and learning gaps, the Universal Screener intentionally includes questions from multiple grade levels. This structure provides sufficient “reach” to pinpoint student strengths and weaknesses below the target grade level.
- Grades two and above:
- Approximately 50 percent of items align with the target grade level
- 25 percent aligns to one grade below
-
25 percent aligns to two grades below
Kindergarten:
- Two distinct forms are available to reflect earlier and later kindergarten content, recognizing the rapid developmental growth that occurs during the year
Generate the Universal Screener: RtI Recommendations Report
Navigate to the Reports Tab
Navigate to the Reports tab, then click Assessment in the menu options on the left.

Scroll to find Universal Screener Results: RtI Recommendations, then click create.

Select the Student Group
Select which students you would like to generate this report for using these steps here.
Report Options
Give your report a name

Choose how the data will be summarized in the report
- Selected Students: This totals all of the data for all of the students you selected and reports it by grade level.
- Individual Student: This shows summary data for each individual student, as well as totals.
Select the Testing Windows to include in the report

Review your selections and click Create.
A new window will open displaying a preview of the report. The two formats this report is available in are indicated in the top right corner of the screen.
Clicking the back arrow allows you to adjust the report settings and generate a new report

What to Look For
As you read the report, notice the following items:
Tier Performance: A dot and support definition is shown above the table.
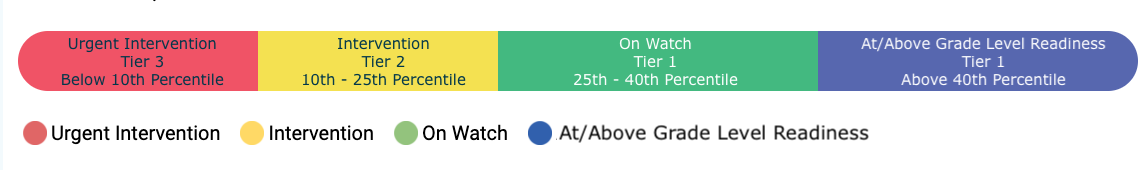
- Tier 3 Support: Urgent Intervention (below 10th percentile)
- Tier 2 Support: Intervention (between the 10th and 25th percentile)
- Tier 1 Support:
- On Watch (between the 25th and 40th percentile)
- At/Above Grade Level Readiness (40th percentile or above)
Date of Assessment: The date the student completed the assessment is shown
Duration: The total length of time the student spent completing the screener is displayed in hh:mm:ss
Rush Indication: A warning symbol is shown if a student spent less time than their peers in completing the screener.
Scaled Score: The overall score earned by the student. Read more about Scaled Score Targets here
Percentile Rank (PR): The normed percentile score earned by the student on this screener. Read more about percentile ranks here
Grade Level Equivalency: The overall and domain-specific equivalents earned by the student
| Reading Domain Abbreviations | Math Domain Abbreviations |
|
|---|---|---|
| GUM - Grammar/Usage/Mechanics | ALG - Algebra | NUM - Numeration |
| READ - Reading | GEO - Geometry | OP - Operations |
| WA - Word Analysis | MP - Mathematical Processes | SP - Statistics and Probability |
|
|
MEAS - Measurement |
|
Accommodations Utilized: The icons displayed below the table will also be included next to the student's name if they were utilized during the screener administration.
Sample PDF Reports
Summarize by Selected Students
The report is formatted as a roster-style report with multiple students' data appearing on the same page.
Students are grouped by overall performance as measured by percentile rank

Students who didn't complete an assessment within this testing window are grouped at the end of the report

Summarize by Individual Student
The report is formatted with each individual student's data appearing on separate pages.

Export to CSV
To export the Rti Recommendations file:
- Follow Steps 1-5 above.
- Click CSV in the top right corner of the screen.
Sample CSV Report
You can export the results of a Universal Screener test administration to a CSV or tab-delimited data file. The data file can be opened in a spreadsheet to manipulate the data as needed. For example, you may wish to sort the data to find your bottom 25% or top 25% of students.

The file contains the following Universal Screener data:
- Test name
- Student District ID
- Student name
- Correct/Attempted for each strand assessed
- Student's scaled score for each attempt
- Readiness score (based on the corresponding testing window)
- Testing Window in which the test was administered
- Date student completed each assessment attempt
- Duration (in seconds)
- School name