How do I graph Oral Reading Fluency results for a student?
|
Range of Words Correct per Minute (WCPM) |
Developmental Level Recording Document and Graph |
|
0 - 120 WCPM |
|
|
20 - 140 WCPM |
|
|
45 - 165 WCPM |
|
|
65 - 185 WCPM |
|
|
75 - 195 WCPM |
|
|
90 - 210 WCPM |
Determine a Fluency Baseline Score
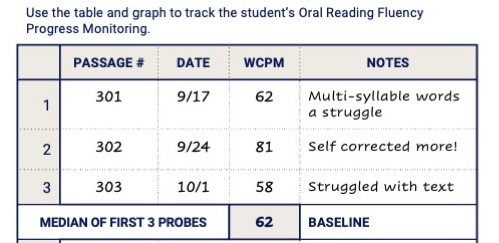
After a student has three oral reading fluency scores, there is enough data to determine the baseline score. The baseline is the median of the three scores. A stable, clear baseline based on performance on three passages strengthens reliability and takes into account the practice effect.
|
On the table to the right, Michael, a 3rd-grade student, is using Level 3 read:
To find the median, put the scores in order: 58, 62, 81 The median is the middle score, which is 62 in this scenario |
|
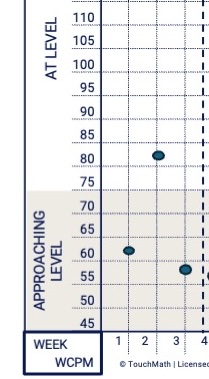
Graph the Words Correct per Minute (WCPM) for the Baseline Scores
Graph the Remaining Results
- Monitor the student's fluency by having them complete a timed reading of one passage each week for the next 9 weeks.
- Note the passage number, date, WCPM and any anecdotal notes and place the student's performance on the graph.
Each graph includes three shaded ranges; approaching level, at level, and exceeding level. These ranges are based on Hasbrouck-Tindal's 2017 Norms for the corresponding grade levels.
- Approaching Level includes WCPM up to the Fall 50th Percentile *
- At Level includes WCPM between Fall 50th Percentile to Spring 75th Percentile *
- Exceeding Level includes WCPM from Spring 75th Percentile
*1st grade ranges use Winter norms rather than Fall norms.
Determine the Student's Rate of Improvement
The student's rate of improvement is the trend between WCPM over the weeks of the progress monitoring session. Classworks uses Hasbrouck-Tindal's 2017 growth norms at the 50th Percentile to determine if a student's rate of improvement (ROI) is on or below target.
Growth norms over the course of 12 probes for other percentiles are included for your reference below.
Hasbrouck-Tindal 2017 Fluency Growth Norms by Percentile
Average Improvement in WCPM over 12 probes
|
Grade |
10th pctl. |
25th pctl. |
50th pctl. |
75th pctl. |
90th pctl. |
|
1 |
6 |
13.2 |
22.8 |
24 |
14.4 |
|
2 |
7.2 |
13.2 |
19.2 |
15.6 |
14.4 |
|
3 |
8.4 |
12 |
10.8 |
13.2 |
12 |
|
4 |
8.4 |
10.8 |
14.4 |
13.2 |
12 |
|
5 |
22.8 |
12 |
9.6 |
6 |
6 |
|
6 |
1.2 |
3.6 |
6.3 |
4.8 |
7.2 |
Monitor the Student's Rate of Improvement
The teacher graphed Michael's WCPM on each of the remaining probes.
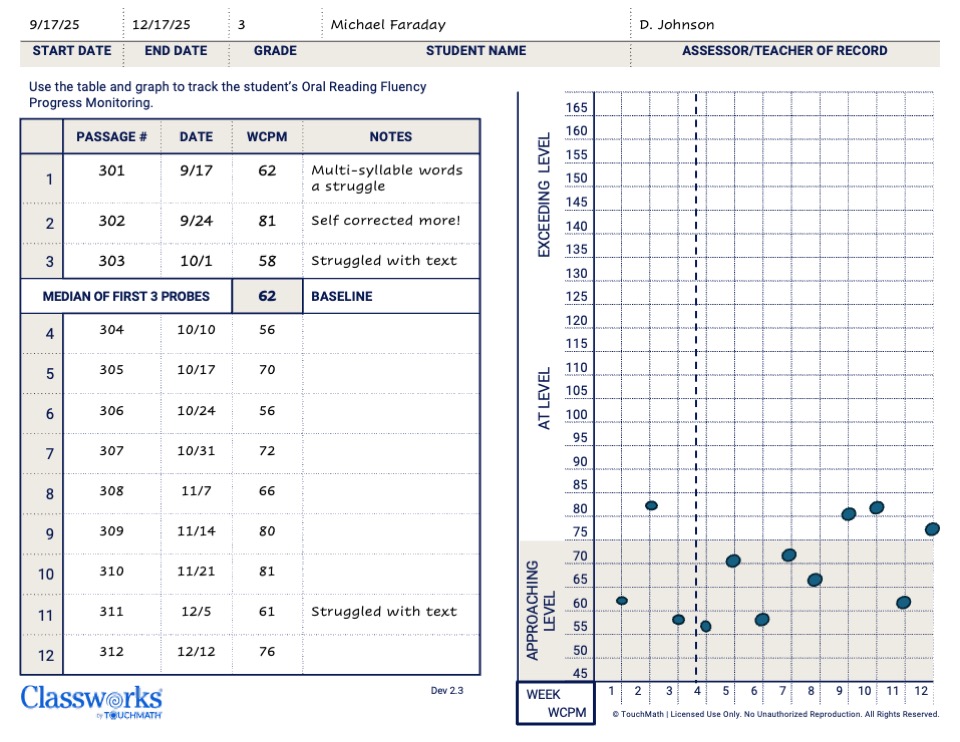
Look at Michael's graph above and notice:
- Michael's baseline was in the Approaching Level range
- Michael's WCPM placed him in the At Level range on 4 of the 12 probes
- Michael's WCPM on the final passage indicates he is still "Approaching Level" with reading fluency.
- The "At Level" range extends from the 50th to the 75th percentile for each grade level.
- Form 2 is designed for use with 2nd graders.