Curriculum Sampling Student Results
For Special Educators, this is the report you are likely sending home every nine weeks to parents, and for MTSS this report is great for student support team meetings. You can see in real-time if students are responding to their interventions and make adjustments early in the year if they are not.
Printing Student Results
1. Navigate to the Reports tab then click Progress Monitoring in the menu options on the left.
2. Click create under Curriculum Sampling Student Results.
4. Choose your Report Options: 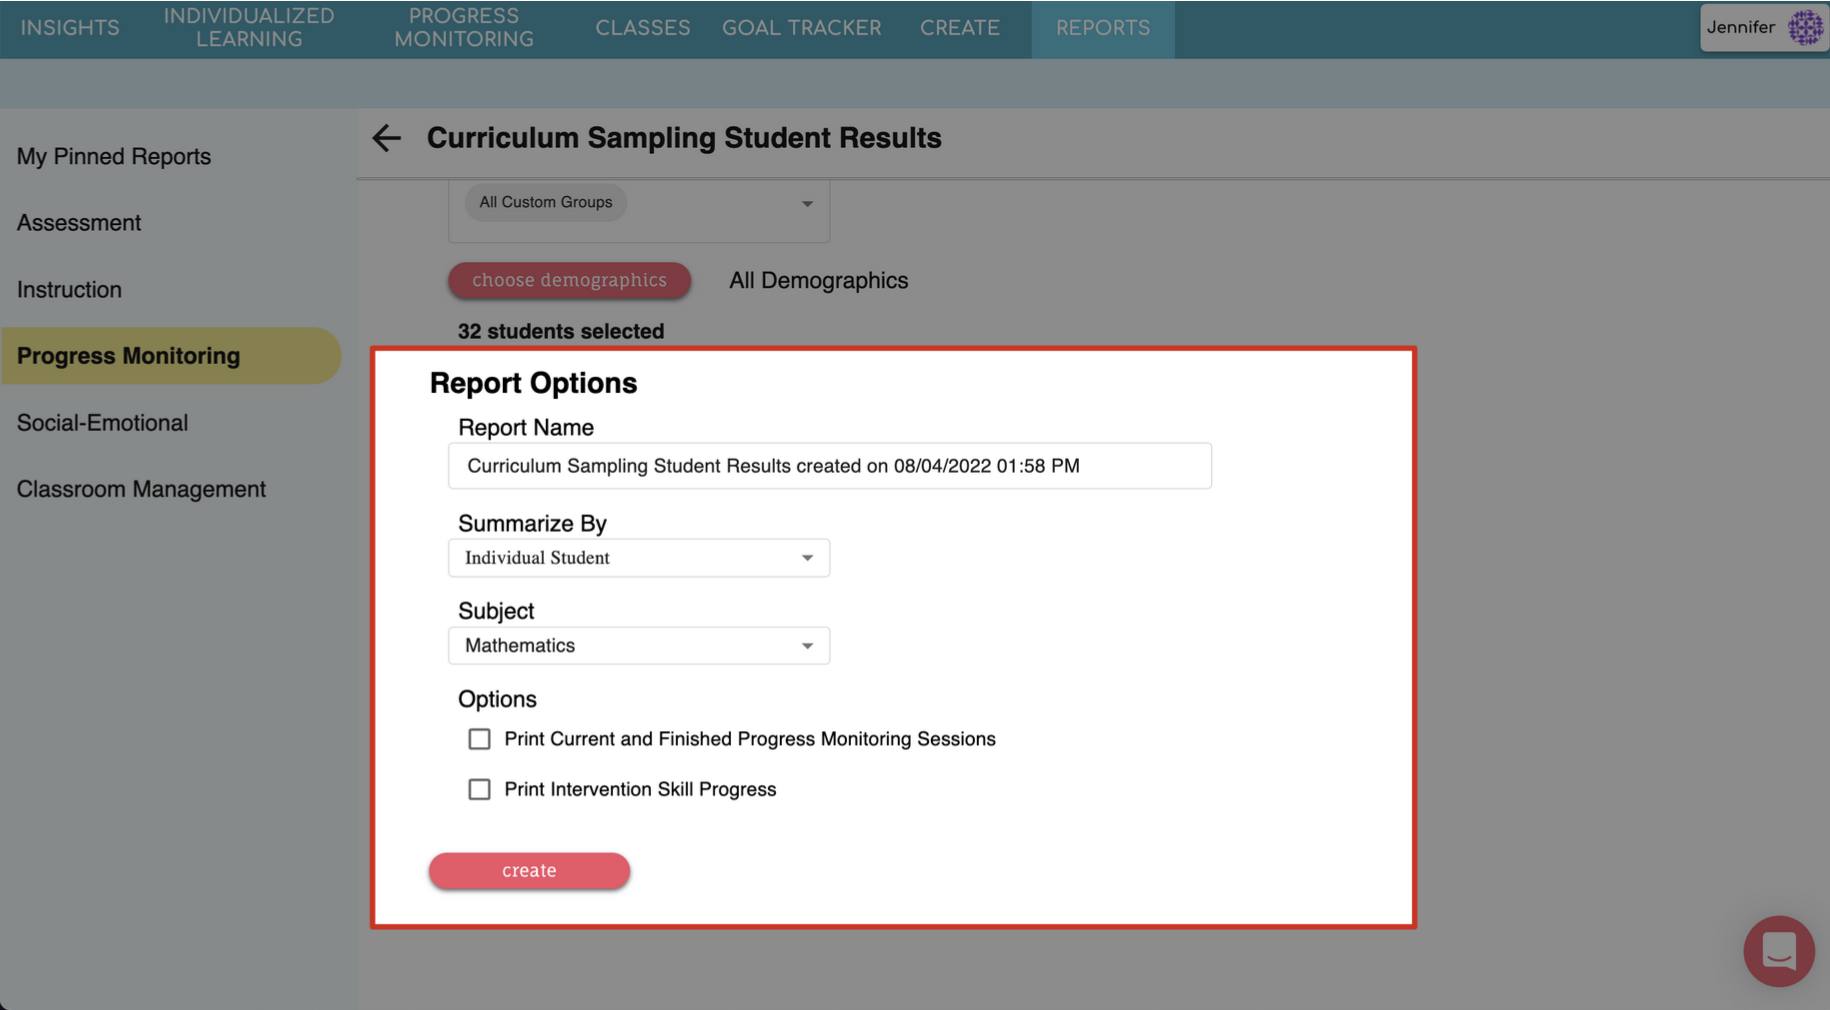
Give your report a name
Choose to Summarize By Individual Student
Select the subject (Mathematics or Language Arts)
Check the box next to the desired Options
5. Review your selections and click create.
6. A preview of your report will appear! Click PDF in the top right to print or download the report or click the back arrow on the left to return to the settings if changes needed to be made.
- Here is a minute video on how to print prior progress monitoring sessions.
What to Look For
Compare the student’s trend line vs the target line (more information on this here)
How much time did the student spend on their weekly probe? Could this affect how the student performed on that weekly probe and if during the current week, should it be reassigned?
Were any weekly probes skipped?
Were any notes added by a teacher to better understand how or why a student performed?
How many weekly probes are remaining?
How did they do in each domain/question on each weekly probe?
Example
In the Curriculum Sampling CBM example below, we can see this student is not on target to meet their goal at the end of the 12-week progress monitoring session.
Using the Progress Monitoring Results table, we can see if the student has missed any weekly probes thus far (would show as “skipped”), how much time they’ve spent on each weekly probe (did they fly through it or take their time), and any notes a teacher has added. These notes help to provide insight into why a student may have performed poorly for that week.
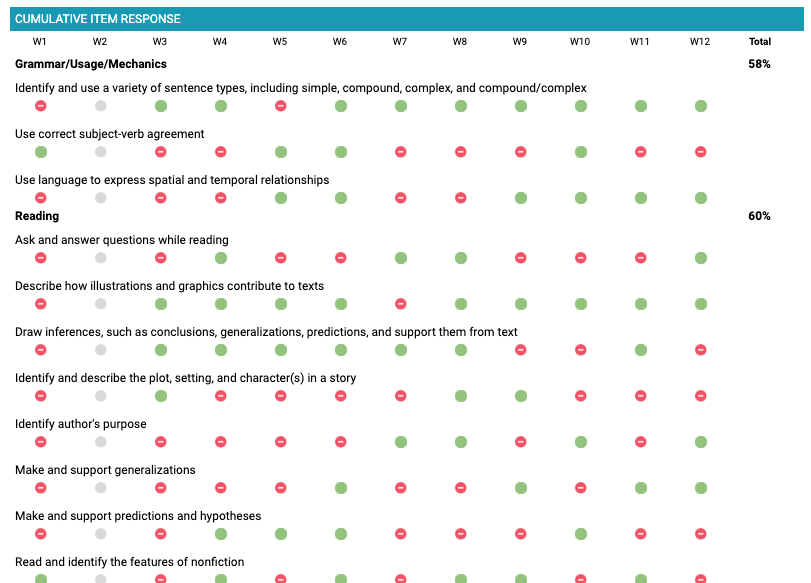
The secondary page of the report provides a Cumulative Item Response table. This table breaks down which domains and assessment objectives the student was tested on, and how well they did.
Depending on the number of correct answer in the Assessment Objectives depend on the item color the report will display.
Red = 0% - 39%
Yellow = 40% - 59%
Green = 60% - 100%
Total is the running percentage across the entire domains for all completed probes.
Related Articles
Domain Based Student Results
For Special Educators, this is the report you are likely sending home every nine weeks to parents, and for MTSS this report is great for student support team meetings. You can see in real-time if students are responding to their interventions and ...
Custom Assessment Results: Student Progress Report
A Custom Assessment is used to assess knowledge of particular skills, strands and/or standards. It can be administered frequently and is used to measure a small number of very specific skills or used broadly to measure a full nine-week period. It can ...
Individualized Learning Results Report
This report gives users the ability to effectively visualize and monitor student usage and results in students' Individualized Learning Paths. Teachers may consider adjusting assignments as the year progresses when more on and above-grade-level ...
Mastery Measurement Results
You see the type of progress students are making toward the short-term objectives of their IEPs. This is the report you are likely sending home to parents, and for MTSS this report is great for student support team meetings. Printing Student Results ...
Assignment Results Report
The Assignment Results report enables you to view how a class or a student is performing on a Classworks assignment. You can view both the unit activities scores and the final unit test score. You also have the option to view a list of all assigned ...